The Durability Economy
Workforce Redesign, Fair Chance Hiring, and Household Stability.
For Leaders Who Measure What Lasts.
Sentenced to Prison
(During my Second Incarceration)
the Architecture
Featured Insight
From Policy Theater to Operating Results
The Fair-Chance Paradox: From Policy Theater to Operating Results
The workforce system measures placements. Employers measure retention. Funders measure grant cycles. None of them measure household stability — and that's why outcomes haven't changed in 20 years. This piece names the blind spot and gives you the numbers to fix it.
Read the ArticleExplore by Topic
Fair-Chance Hiring
The business case, the retention data, and the infrastructure that makes inclusive hiring sustainable — not just symbolic.
Workforce Architecture
Systems design for coordinated career pathways — connecting employers, training, support services, and retention infrastructure.
2Gen Economy
The household-centered model that invests in two generations simultaneously — parent careers and child development, aligned.
Policy and Metrics
What we measure determines what we get. Analysis of the incentive structures, funding models, and measurement systems that shape outcomes.
Reinvention and Lived Experience
The personal, the systemic, and the structural — why reinvention is a better frame than reentry.
The Ideas That Run Through Everything
We Measure the Wrong Thing
Workforce systems optimize for placements. Funders optimize for grant cycles. Corrections optimizes for compliance.
None of them optimize for household stability.
When the metric is wrong, the outcome is predictable. Change the metrics. Change the outcomes.
Household Stability Is the Real Unit of Change
You cannot stabilize a worker without stabilizing their family.
A parent navigating housing instability, child care gaps, and benefit cliffs is not a retention problem. They are a systems-design problem.
The household is the unit. Everything else is a workaround.
Hiring Is the Beginning, Not the Finish Line
The system celebrates placement. The worker needs advancement.
Fair-chance hiring without retention infrastructure is a revolving door with better PR. Wage progression, manager support, and career pathways — that is the finish line.
A job is not freedom. A career is closer.
Systems Must Be Designed for Measurable Outcomes
Good intentions are not a substitute for good design.
If a program cannot articulate its outcomes at 12 months — with numbers, not narratives — it is not ready to scale. It may not be ready to fund.
Design for durability. Measure for accountability. Fund what works.
The ROI of Fair-Chance Hiring: A Data Snapshot
Hard numbers and practical proof. The retention data, the tax credit math, and the business case — in one document.
- Retention comparison: fair-chance hires vs. general population
- WOTC tax credit calculation framework
- Cost-of-exclusion model for employers
- Three implementation steps you can start this quarter
Start Here — For Your Role
For Employers
You're building or scaling a fair-chance hiring strategy. You need the retention data, the infrastructure framework, and the ROI case to present to leadership.
For Funders
You're investing in workforce and reinvention outcomes. You need to know what produces durability — not just activity — and how to structure funding around household stability.
For Policymakers
You shape the rules, the incentives, and the measurement systems. You need evidence that connects policy design to real-world outcomes — with clear metrics and implementation pathways.
For Workforce and Reinvention Leaders
You run the programs. You coordinate the services. You see the gaps every day. You need frameworks that work at the systems level — not just the program level.
From Insight to Implementation
The thinking on this page is the foundation. Here's where it becomes action.
Need Strategy?
Consulting engagements for employers, funders, workforce boards, and public agencies. We design systems, build playbooks, and stay through implementation.
Explore Consulting →Need a Speaker?
Keynotes, workshops, and executive briefings that challenge systems thinking and move audiences to action. Customized for your event and audience.
Explore Speaking →Need the Model?
The 2Gen Economy Blueprint — the systems-level blueprint for household-centered workforce development. The full explanation, the phases, and the tools.
Explore the Blueprint →Take the Next Step
Get the Data
The ROI Snapshot — retention numbers, tax credit math, and the business case for fair-chance hiring. Request your copy.
Request the ROI SnapshotStart the Conversation
Explore consulting engagements or start a discovery conversation to discuss your organization's workforce and systems-change goals.
Start the Conversation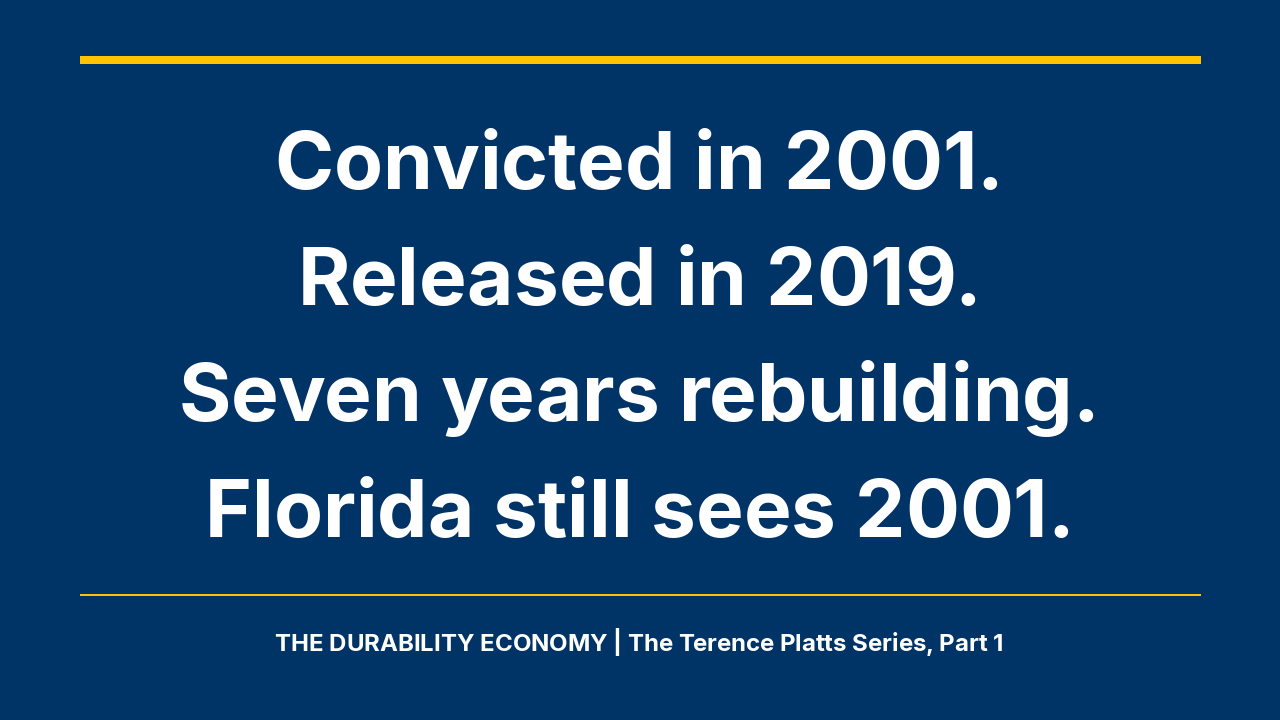
Terence Platts was convicted of attempted robbery with a deadly weapon in 2001. He served eighteen years and three months, was released in 2019, and has spent the seven years since building exactly the life our systems say they want. On October 1, 2026, Florida will place him under a registration regime copied, almost part for part, from the machinery built for sexual predators. He is not one.
Start with what he built, because the record is the argument.
After his release in 2019, Terence chos...
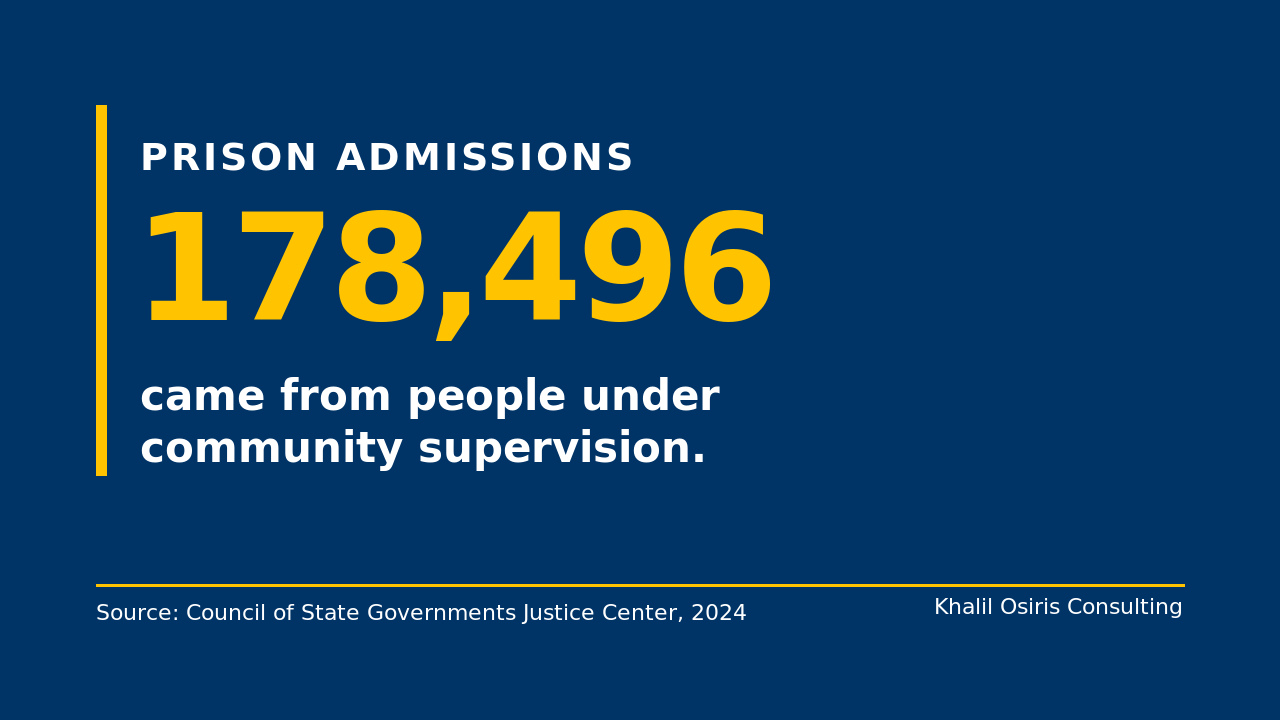
At the end of 2023, an estimated 3,772,000 adults were under community supervision in the United States. The probation population grew 1.3 percent that year while parole fell 2.9 percent, and among comparable agencies the total supervision population declined 23 percent over the decade ending in 2023. The footprint is shrinking, and no supervision agency reports what the shrinkage does for households (Bureau of Justice Statistics).
The field judges that system by compliance, completion, and rec...
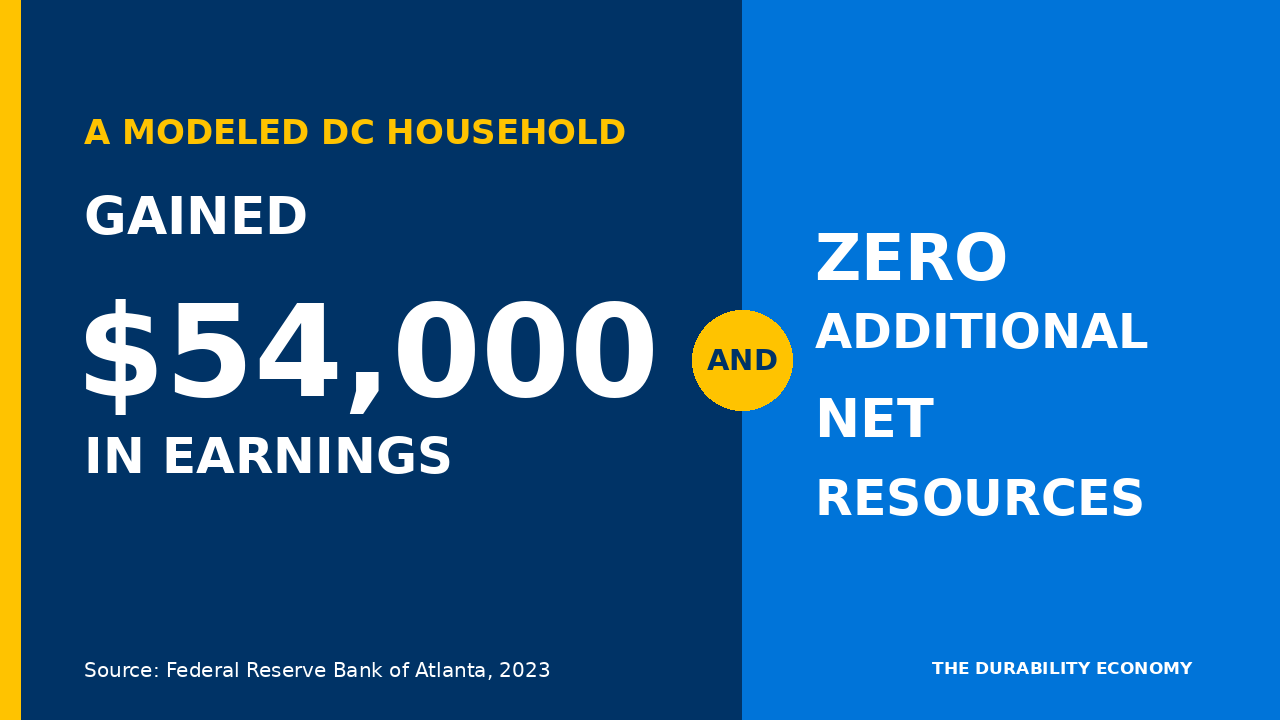
You're measuring the event because it's easy to count. But the household pays the price for what your dashboard can't see.
The newest evidence does not support the story our field is most comfortable telling.
Garin and colleagues linked 464,919 felony defendant-cases in North Carolina and Ohio to IRS records. Their 2025 Econometrica study found a 12-month sentence reduced cumulative five-year earnings by $2,914, or 13 percent, with no detectable damage beyond year five.
Before their cases, ...
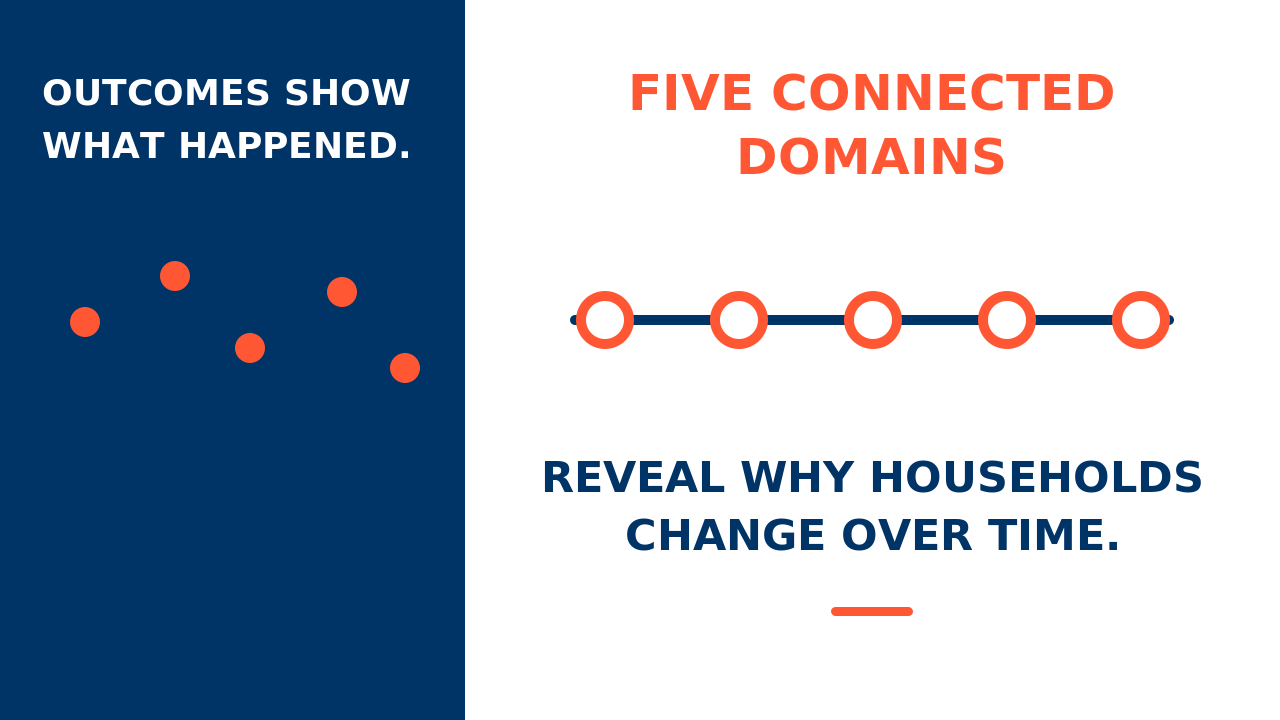
Here’s what the data shows.
Moving to Opportunity (MTO) followed 4,604 households for ten to fifteen years, moving families from high-poverty neighborhoods to low-poverty ones and tracking adult earnings and employment.
No detectable effect on the adults.
The same experiment, reread through tax records years later, found that children whose families used a low-poverty voucher to move before they turned thirteen earned roughly 31 percent more in their mid-twenties. The effect surfaced only when r...
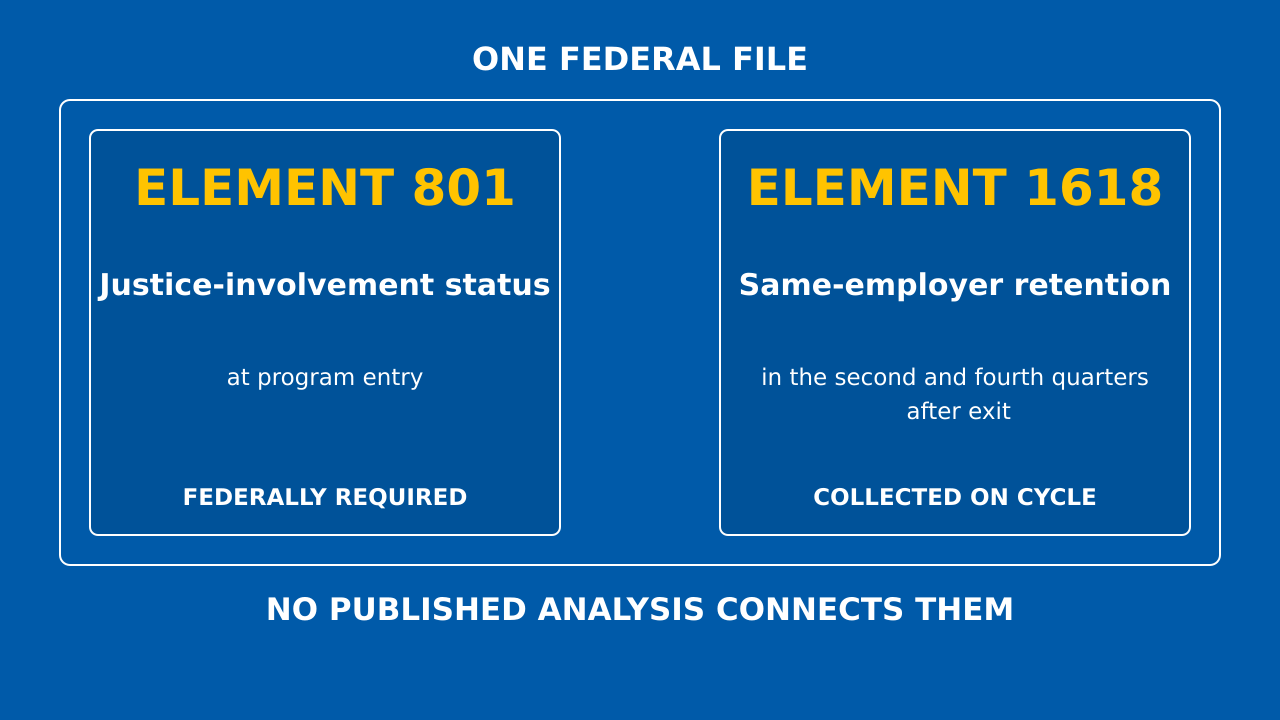
Every fair-chance hiring conversation stalls at the same place.
An employer sits across the table, interested but cautious, and asks the question underneath every other question: is this risky?
The field has an answer ready. Fair-chance hires perform as well or better.
They stay longer. The data is clear.
I went looking for that data.
What the Evidence Actually Shows
I ran a verification pass across seventeen candidate statistics, testing each against a basic standard: a named primary source, pu...
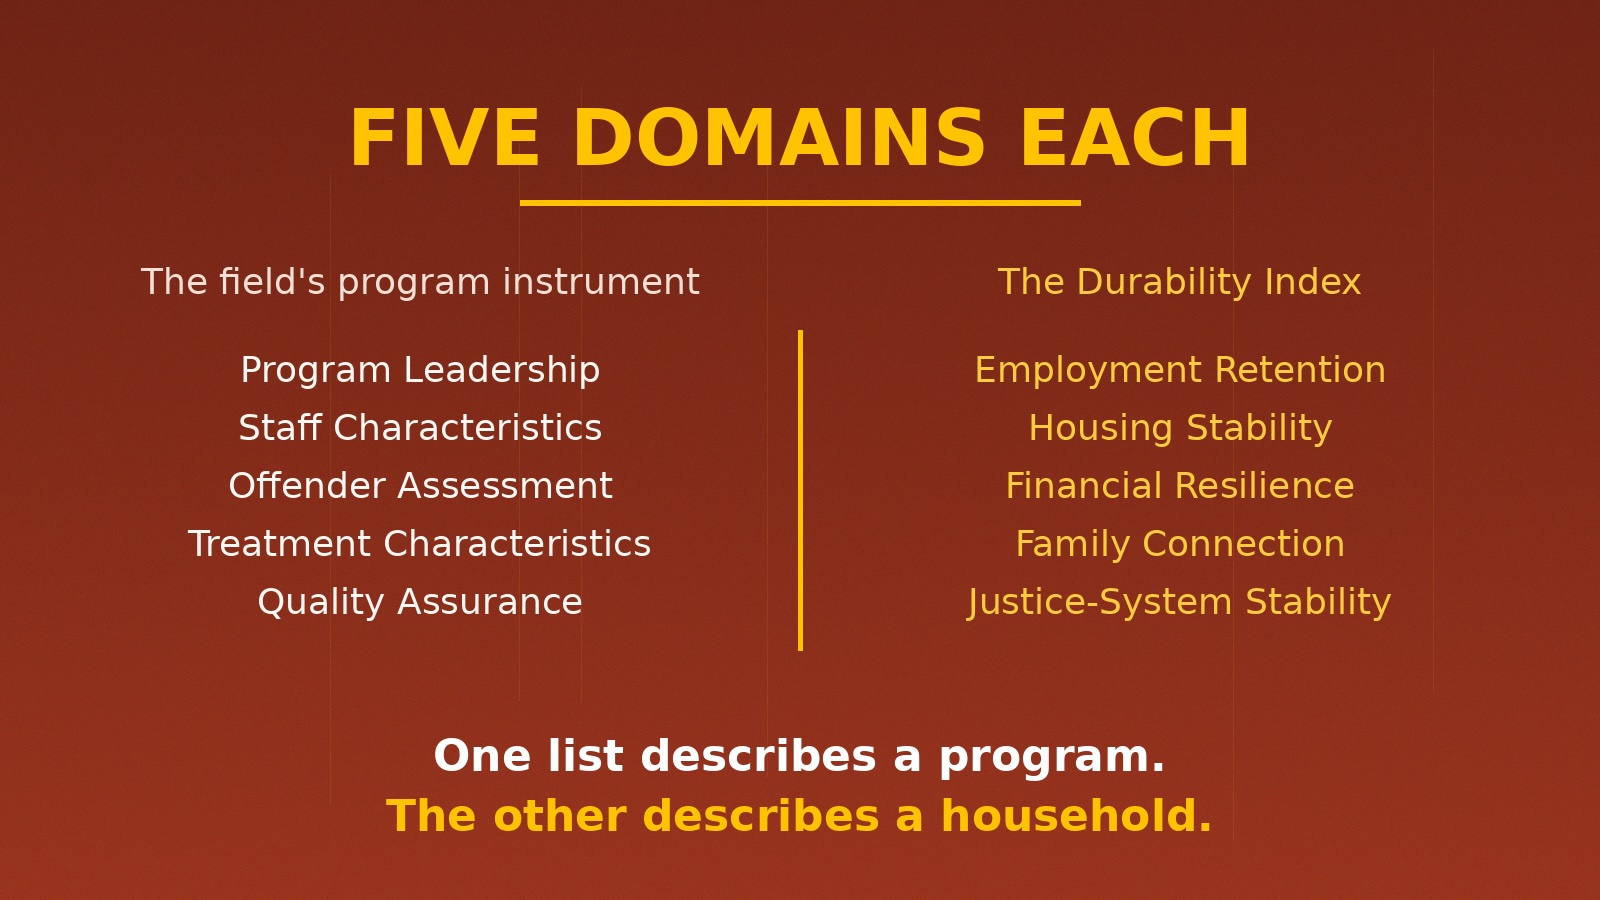
In October 1973, the United States Board of Parole adopted the Salient Factor Score as the risk axis of its parole guidelines.
It scored the person. Prior convictions, age at first commitment, employment history. A number came out, and that number helped decide whether someone went home.
More than fifty years later, the instruments are more sophisticated and the object has never moved. The LSI-R scored the person. COMPAS scores the person.
Every generation points the same direction: at the ind...
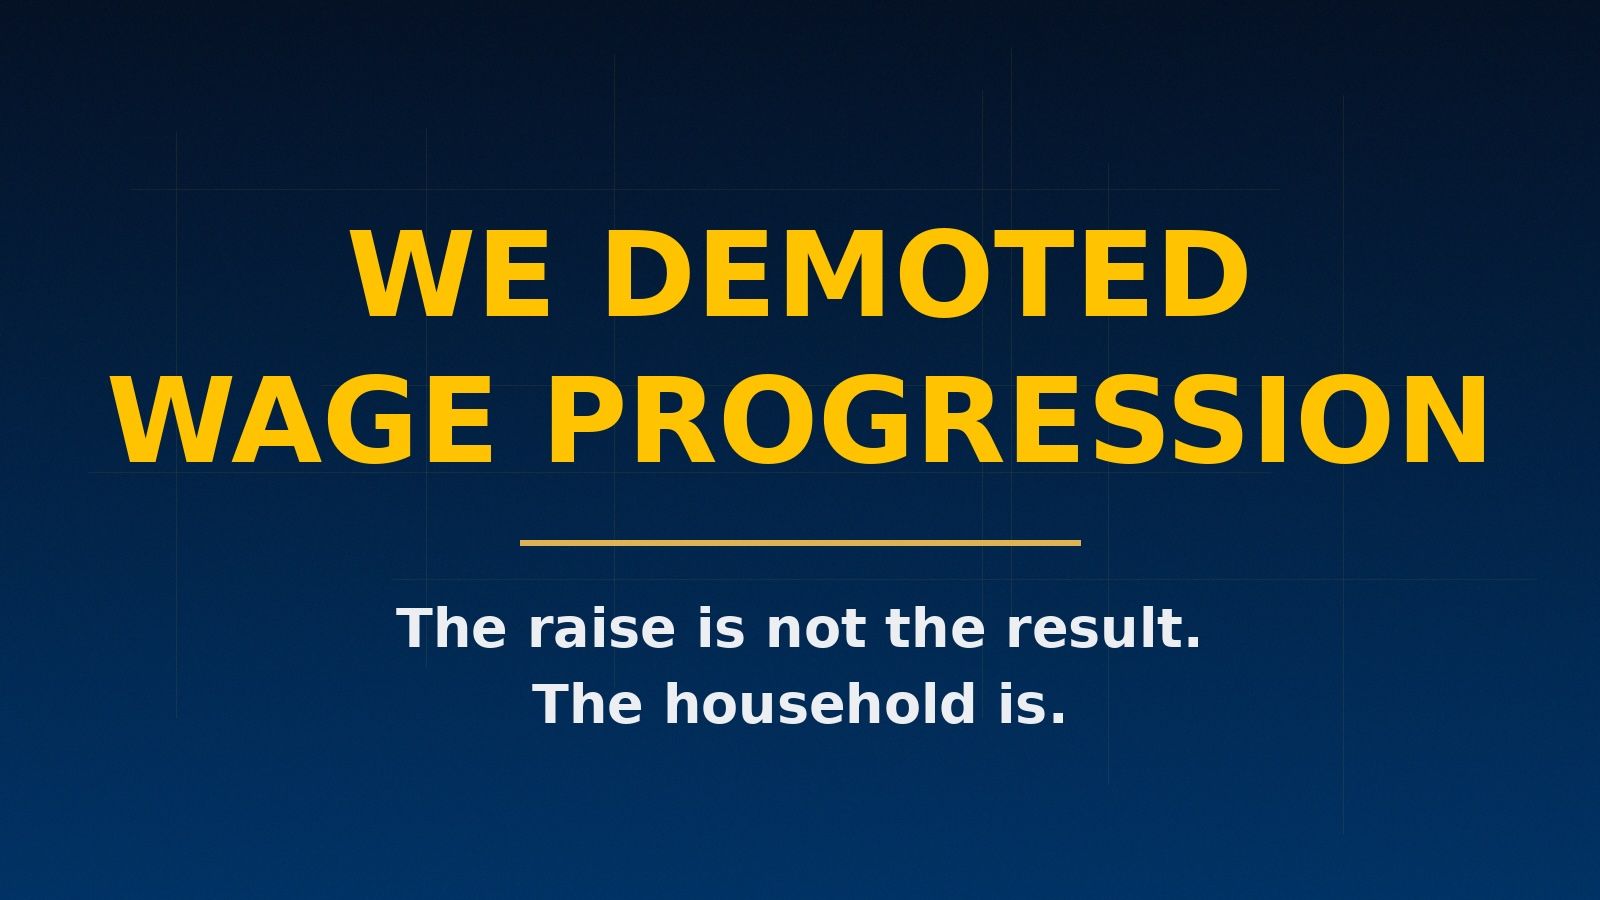
Last week, I changed my own instrument.
The Durability Index measures household stability across five domains. Until July 23, one of those domains was wage progression. It is not anymore.
Wage progression now lives one level down, as a sub-measure inside employment retention. Its old seat at the domain table belongs to Family Connection.
Here's the pattern across fifty years of workforce measurement: the instruments never change. They calcify. This issue is about why mine did, and what the ch...
You built an entire apparatus to fix these systems, and you filed the one data set that could fix them under "story."
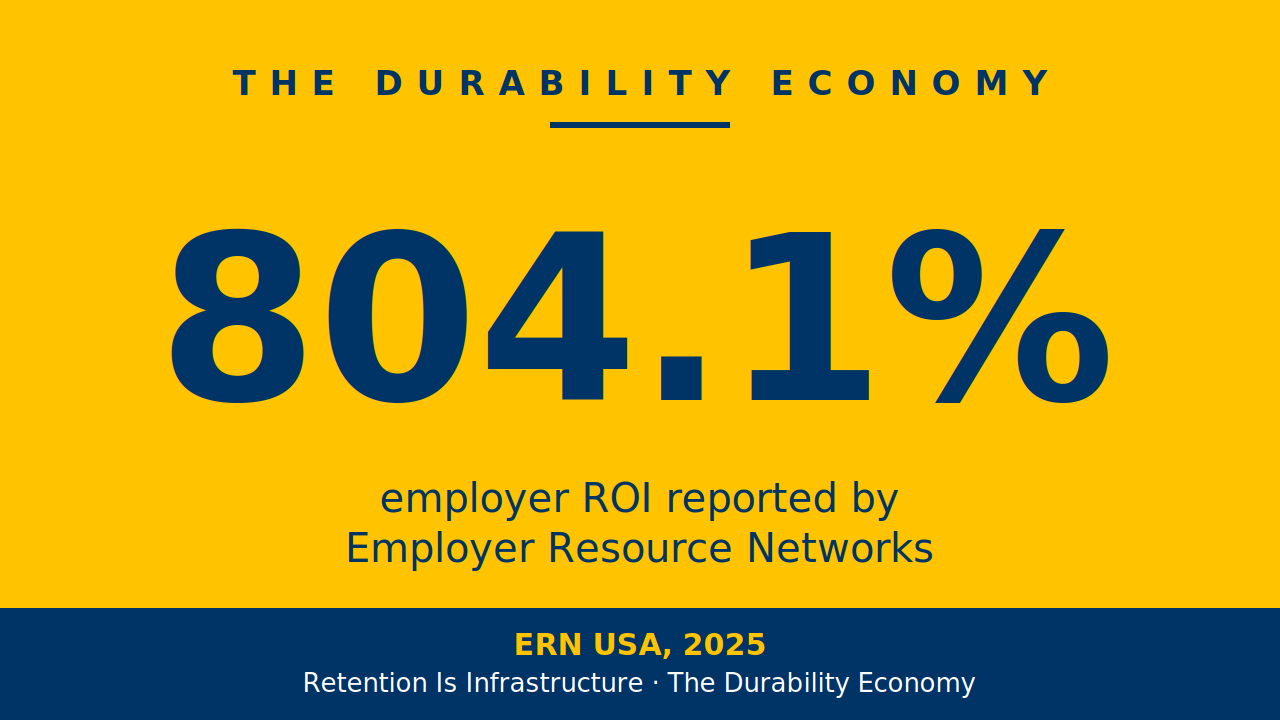
Last Tuesday I handed you one proven strategy: an Employer Resource Network, a success coach on site, retention treated as infrastructure. In ERN USA's 2025 national figures, the model reported an 804.1% return.
One room. One repair. One household caught before it collapsed.
I told you it was one room of a larger architecture. This week the whole architecture has a name, and it ...
The most expensive line item in most workforce budgets does not have a name.
It hides inside other names. Recruiting. Onboarding. Overtime. Temp coverage. Training hours for people who leave before the training pays back.
Added up, those names describe one thing: the cost of losing workers you already had.
Most employers treat that cost as weather. It happens, you absorb it, you hire again. But a growing group of employers treat it as an engineering problem instead.
They have a structure for it,...
Every workforce leader in America can recite the diagnosis by now.
Placements collapse. Retention leaks. The metrics count the wrong thing.
You have read it a dozen ways. You have read it from me.
Here is what almost no one puts in front of you. An employer who stopped diagnosing the problem and built the fix.
Not a pilot. Not a theory. A factory, with numbers.
The factory that stopped losing people
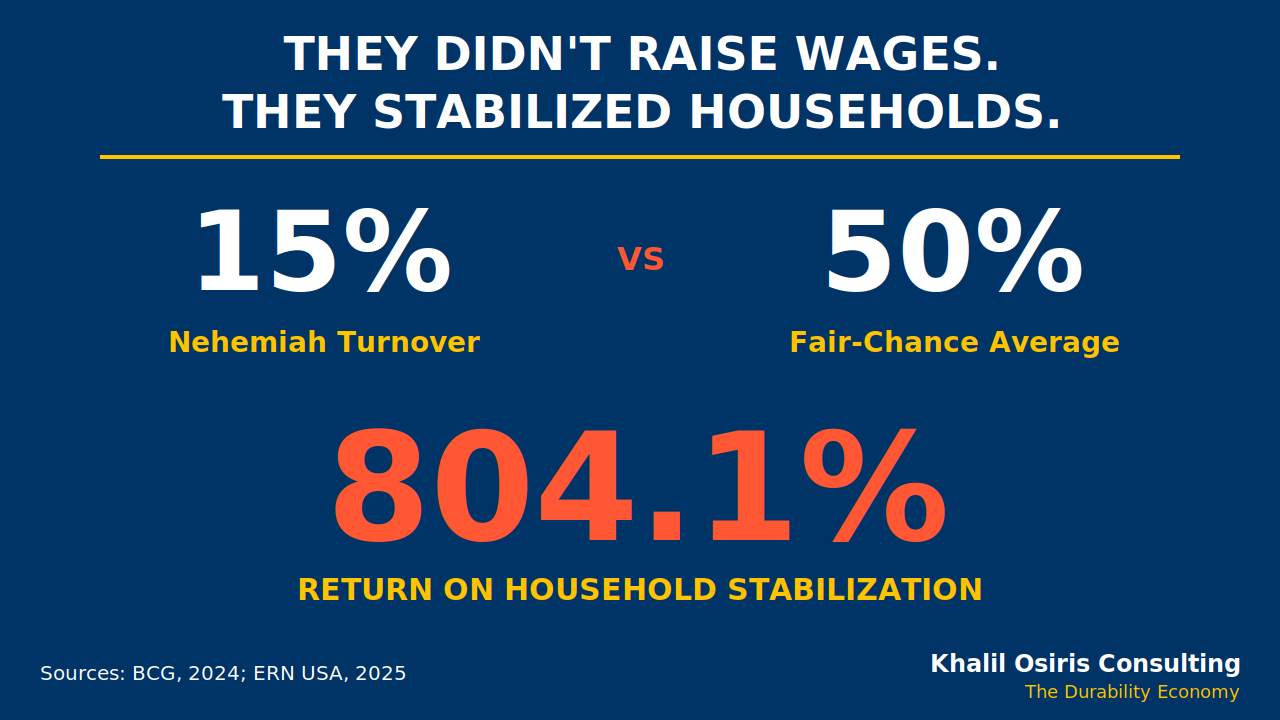
Nehemiah Manufacturing in Cincinnati staffs most of its floor with people who have criminal recor...
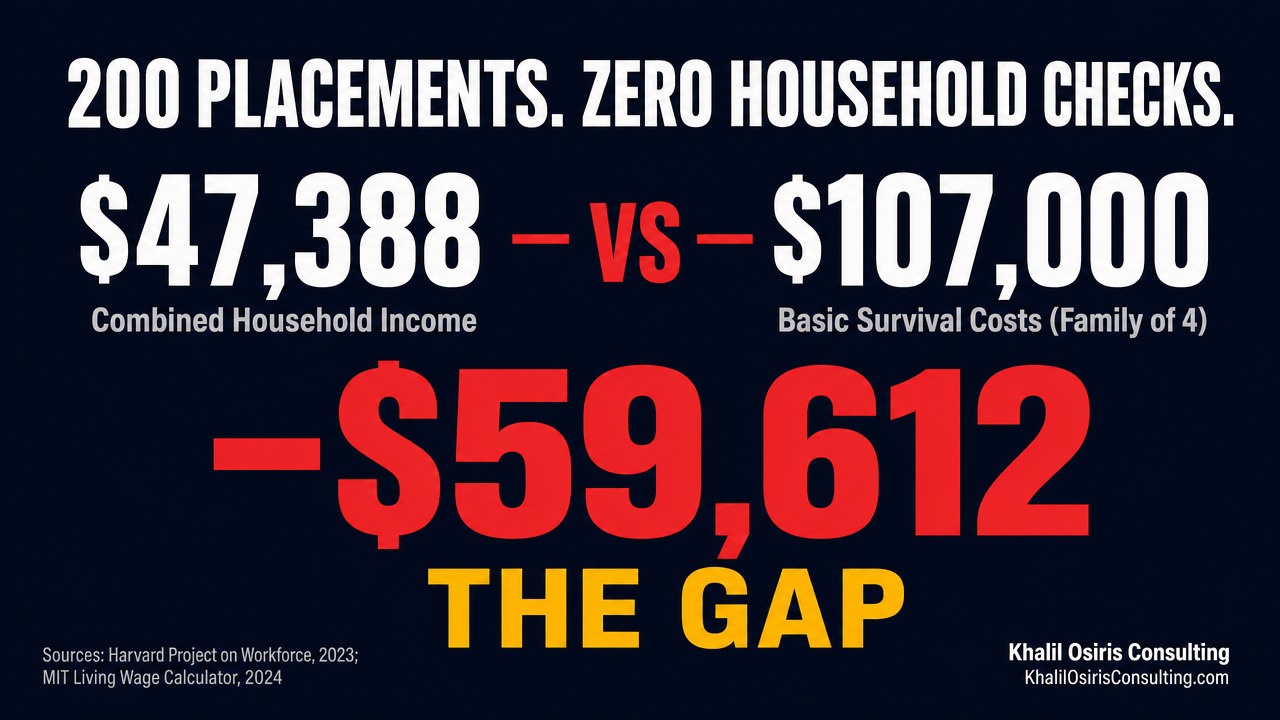
Your workforce program placed 200 people last year and never checked whether a single household survived the offer.
Here is the question nobody on your board asked: how many of those 200 workers earned enough to keep a roof over their family, child care covered, and food on the table at the same time?
Not sequentially. Simultaneously.
The answer was not in your report. The placement was the finish line. The household was never part of the equation.
And your annual report called it a success.
T...
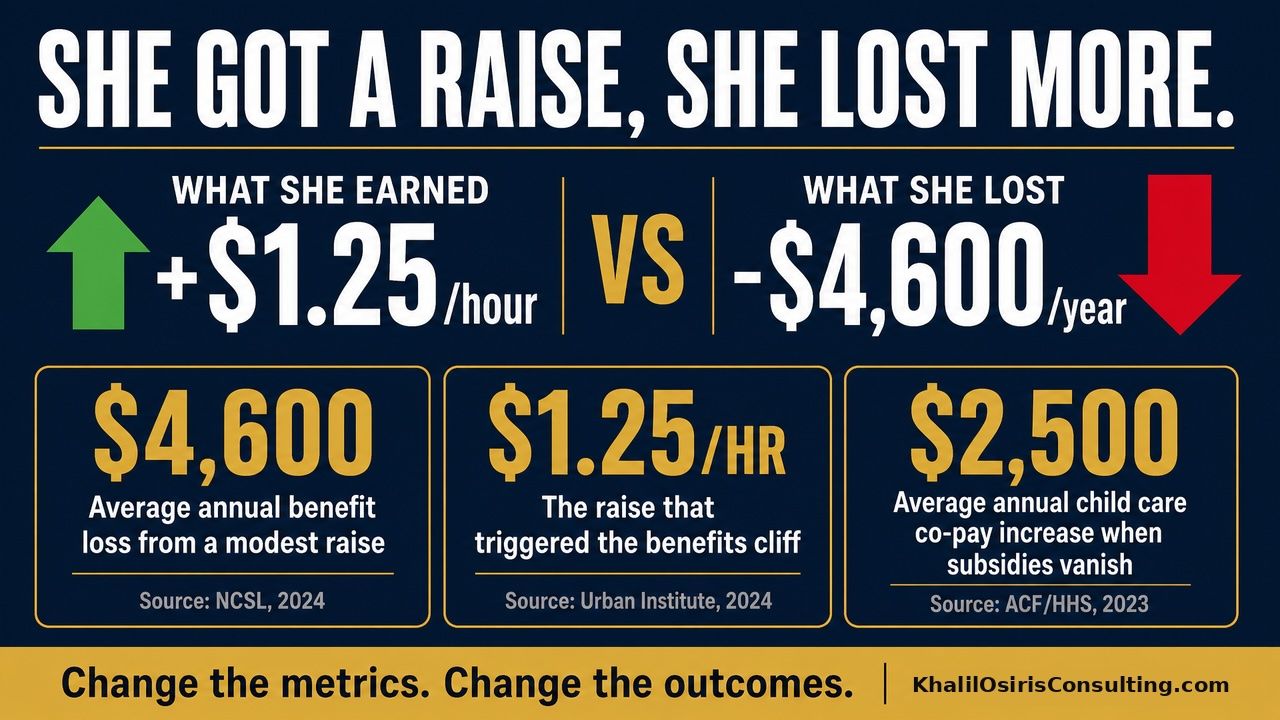
Keisha Thompson got a raise last month. One dollar more per hour. Her supervisor signed the paperwork. HR sent the congratulations email. Payroll updated the system.
Nobody modeled what happened next.
That $1/hour raise, $2,080 per year before taxes, pushed her household income from $33,000 to $34,000.
In Ohio, that $1,000 increase triggered the loss of more than $4,600 in public benefits (Sen. Jon Husted, Upward Mobility Act, 2026).
The raise your HR team celebrated just cost her household more...
The Durability Index
Free Household Stability Scorecard
Stop measuring placements. Start measuring what lasts. Score five domains across 12–24 months.
Download Free →