You Filed Their Experience as a Story. It Was the Data Your Redesign Needed.
Jul 21, 2026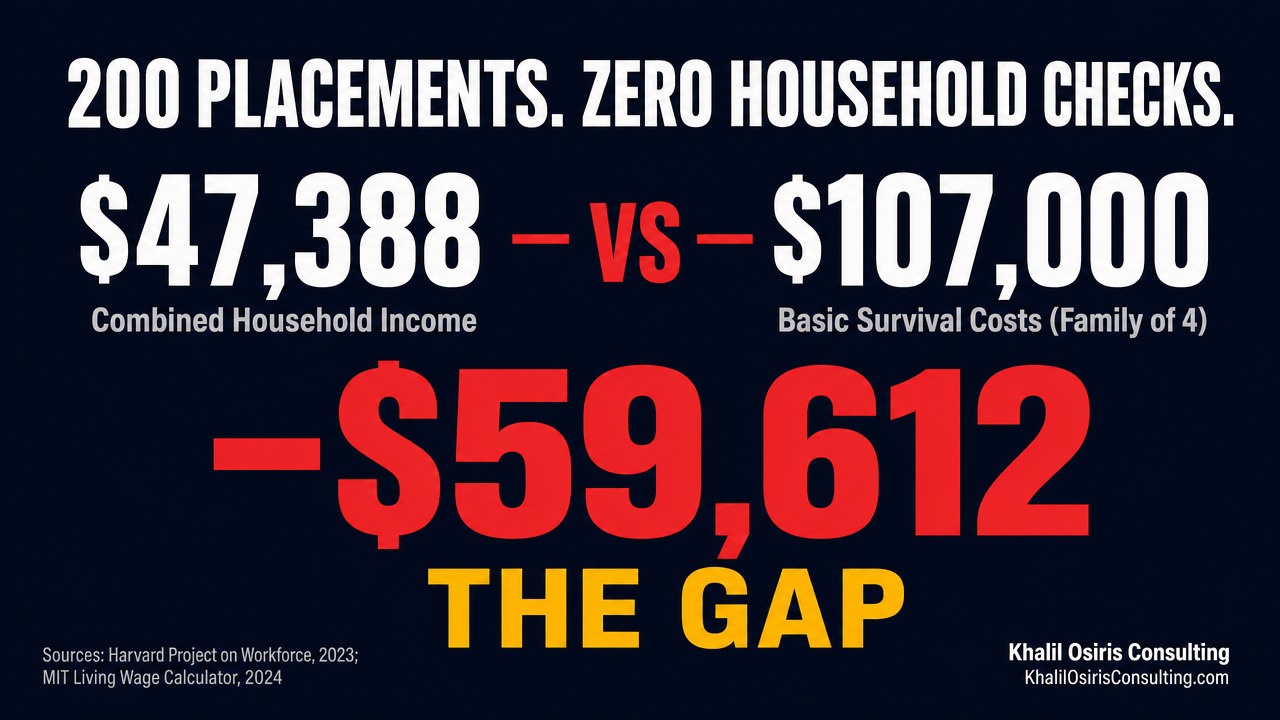
You built an entire apparatus to fix these systems, and you filed the one data set that could fix them under "story."
Last Tuesday I handed you one proven strategy: an Employer Resource Network, a success coach on site, retention treated as infrastructure. In ERN USA's 2025 national figures, the model reported an 804.1% return.
One room. One repair. One household caught before it collapsed.
I told you it was one room of a larger architecture. This week the whole architecture has a name, and it is available now.
The name is a claim, not a slogan. Lived experience is system intelligence.
The people your systems process are not stories waiting to be featured on a panel. They are the intelligence your redesign has been missing, and you have been filing it under the wrong word.
The Data Set No Dashboard Holds
Start with the number your systems already publish, then run the one they never do.
The median WIOA Eligible Training Provider program shows annualized earnings of $29,388, according to Harvard's Project on Workforce analysis of more than 75,000 federally funded programs (Harvard Project on Workforce, 2023).
That is the system performing exactly as designed. It rewards the placement, not the household the placement was supposed to sustain.
Now measure it against what a household actually needs. Basic necessities for a family of four (housing, child care, transportation, health care, food) run about $107,000 a year (SmartAsset's analysis of MIT Living Wage Calculator data, reported by CNBC, 2024).
Not savings. Not a cushion. Survival.
Here is the subtraction stack, and it is one you can run yourself. Readers of these pages have run it before; the book is what it was building toward:
- Median WIOA Eligible Training Provider program earnings: $29,388 (annualized)
- Partner income, modeled part-time: $18,000
- Combined household income: $47,388
- Basic necessities, family of four: $107,000
- The gap: -$59,612
The $18,000 partner income is a modeling assumption, not a measured statistic: a deliberately conservative part-time figure, held constant so you can rerun the stack against your own local numbers.
Two adults working. Everything the system asked of them, done. And the household is $59,612 short before it buys a single bag of groceries.
No dashboard flags that number, because no dashboard measures the unit where it lives. That missing measurement is the data set my new book is built from.
The Thompson Household, Month by Month
Lamar Thompson completed a 12-week logistics program in the spring. His workforce provider logged the placement: $15.50 an hour, full-time, benefits after 90 days.
On the dashboard, a success.
Here is what the file could not record.
Month 1. Lamar grosses $2,687 a month. Rent is $1,450.
Keisha works part-time and brings in $1,083. After rent, the family of four has what is left to cover everything else.
Month 2. Child care for Jaylen and Nia runs $1,100 a month. Transportation to two jobs across town takes another $485.
The margin is already gone.
Month 3. Jaylen needs shoes for school. Nia has a dental visit Medicaid will not cover.
Keisha picks up a weekend shift, and the child care math breaks the moment both parents work weekends.
Month 4. Lamar's car needs a $400 repair. There is no emergency fund, because the household has run a deficit since the first paycheck.
He misses two shifts. The distribution center issues a final warning.
Month 5. Lamar is terminated. The workforce program records a successful 90-day retention.
The dashboard stays green.
The file holds the outcome. The Thompsons hold the causal chain, and only one of those two knows why the system failed.
One Flaw, Three Systems
The Thompson household is not an outlier. It is the median output of measuring events instead of households, and the same flaw runs through every system in the stack.
- 41.3% of U.S. households fall below the ALICE Threshold of financial survival (United Way, 2024).
- The median WIOA Eligible Training Provider program shows annualized earnings of $29,388 a year, less than what a typical worker with no high school diploma earns (Harvard Project on Workforce, 2023).
- 61% of parents have no formal child care arrangement (U.S. Census Bureau, 2023).
- The one model that measures the household instead of the event, the ERN, reported an 804.1% return in ERN USA's 2025 national figures.
Justice measures recidivism, a return event, and never whether the household a person returns to can hold them. Workforce measures placement, a hire event checked at day 90. Family systems measure enrollment, a services event, parent programs here and child programs there, with nothing measuring whether the household the two share is becoming more stable.
Three systems, three event-metrics, one invisible unit.
Each one treats the predictable collapse as personal failure, then points to the metric as proof the person, not the design, was the problem. The household is the variable every one of them refuses to measure.
Three Shifts That Redesign the Measure
From event-metrics to household intelligence
-
Make the household the unit of analysis. Before any placement, run the household income model: target wage times 2,080 hours, minus county-level housing, child care, and transportation.
If the stack comes back negative, the placement is not a success, it is a setup. Ten minutes of math before the offer beats five months of crisis after it.
- MIT Living Wage Calculator: livingwage.mit.edu
- United Way ALICE thresholds: unitedforalice.org
-
Measure durability at intake, 6, 12, 18, and 24 months, not compliance at day 90. A 90-day retention flag told you nothing about the Thompsons; their crisis arrived in month five, long after the file closed green.
Set the success window where the household actually stabilizes or fails, track it quarterly, and report it to your board.
What gets reported gets resourced. What stays invisible stays broken, and the day-90 window was engineered to keep the most important number invisible.
-
Build wraparound family supports into the model and count both generations. Child care access, transportation, and benefit-cliff navigation are not add-ons; they are the infrastructure that decides whether a placement survives.
Count parent mobility and child development as one system, not two programs. That is the 2Gen Economy, and it is what the ERN's 804.1% already proved for one room of the house.
- Durability Index Self-Assessment: khalilosirisconsulting.com/durability-index
This is the architecture in Lived Experience Is System Intelligence: A New Architecture for Redesigning Justice, Workforce, and Family Systems, Book Two of the Reinvention Trilogy, available now on Amazon.
Run the first shift this week. Set the window within 30 days.
Who Owns This
- Workforce boards: Trace one file from last year's successes to month eighteen before your next reauthorization cycle. The household will tell you what you actually funded.
- Employers: Ask your workforce partners what household income threshold their placements are designed to reach, then price your last five preventable exits against it.
- Funders: Move stabilization from a supportive-services afterthought to the measured core. On the reported numbers, it may be the highest-performing component in the stack.
- Policymakers: The definition of success is written into the statute that funds these programs. If it names recidivism and placement and never the household, every downstream metric is obeying the law, not failing it. Rewrite the measure at the top of the chain, and practice follows the money down.
The Decision
Here is the test your dashboard cannot pass.
Take last year's placements and trace each household to month eighteen: the wage, the partner income, the local cost of housing, child care, and transportation. Count how many households are still standing.
If you cannot produce that count, you are not measuring durability. You are measuring departure and calling it success.
The silence in that gap is not a worker's motivation problem. It is a measurement choice you are free to change.
The tools are not the constraint. The math is free, the data is public, and the architecture is no longer theoretical.
It is on a shelf, available now, written from twenty years inside the systems it redesigns.
If you can name the gap and still report the placement, you are not documenting a success. You are documenting a household emergency with a start date.
What does your organization score on this?
Take the free Durability Index Self-Assessment. Twenty questions. Five domains. One score.
Until next time, keep building what they said couldn't be built.
Khalil Osiris
Author and Founder, Khalil Osiris Consulting | Market Architect, The Durability Economy Workforce Architecture
The Durability Economy. Workforce redesign, fair chance hiring, and household stability. For leaders who measure what lasts.
Change the metrics. Change the outcomes.
Subscribe to The Durability Economy
Get the weekly briefing on workforce transformation, criminal justice reform, and the 2Gen Economy, delivered straight to your inbox. Evidence over ideology. Households over headcounts.
We hate SPAM. We will never sell your information, for any reason.