The Data on Fair-Chance Hiring Already Exists. Nobody Is Running the Query.
Aug 11, 2026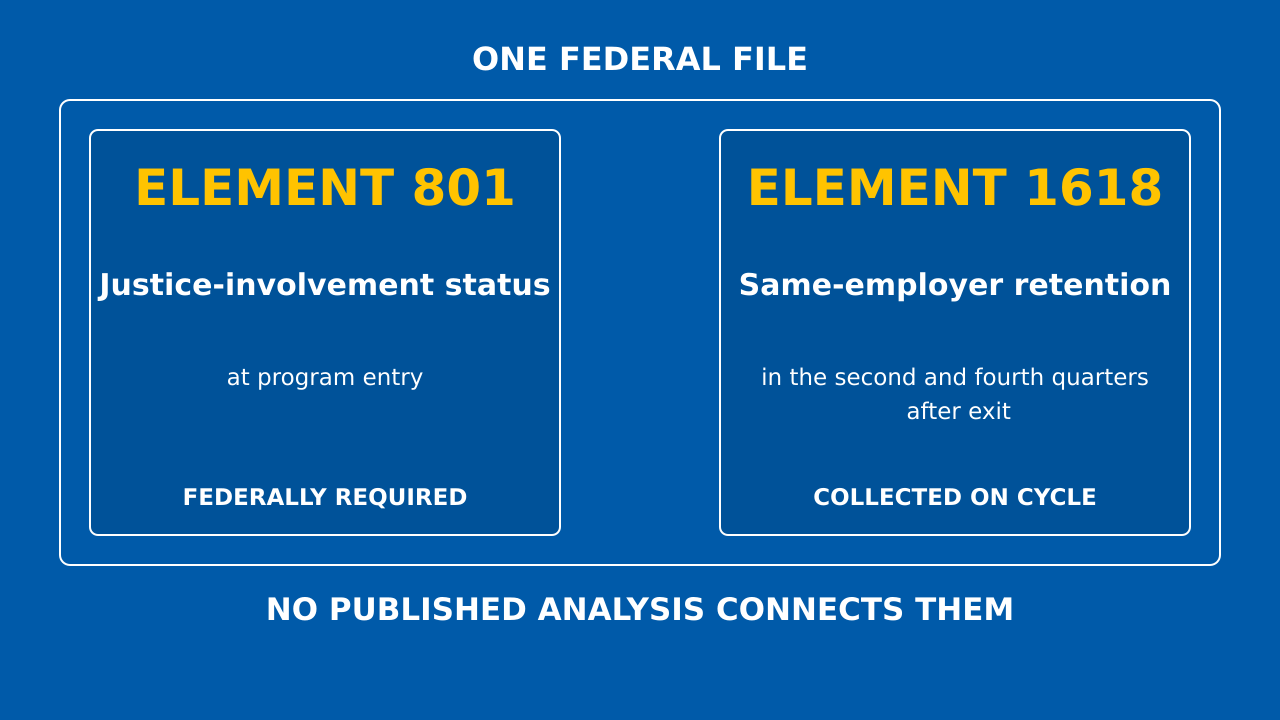
Every fair-chance hiring conversation stalls at the same place.
An employer sits across the table, interested but cautious, and asks the question underneath every other question: is this risky?
The field has an answer ready. Fair-chance hires perform as well or better.
They stay longer. The data is clear.
I went looking for that data.
What the Evidence Actually Shows
I ran a verification pass across seventeen candidate statistics, testing each against a basic standard: a named primary source, published within three years, measuring the actual claim being made.
None survived.
The strongest primary evidence is a Northwestern study of tenure and turnover across private-sector firms. It describes cohorts from 2008 to 2014.
It is careful research. It is also more than a decade old, collected under labor market conditions that no longer exist.
What has been published since reports something else: practice adoption, company narratives, or surveys of what managers believe.
That last category deserves attention.
Perception Is Not Performance
SHRM’s widely cited figures report that 85 percent of HR professionals and 81 percent of business leaders say workers with criminal records perform as well or better than workers without them.
Those figures are from 2021. The survey has not been re-fielded since.
They are belief statements. They measure what managers think about their hires, not retention, tenure, promotion, or turnover.
The figures get cited as though they settle a question about worker performance. They settle a question about manager perception in 2021. Different thing, twice over.
I want to be precise about what this means. The absence of current evidence is not evidence that fair-chance hires underperform.
Nobody has published the measurement recently. Measurement did not come back negative. Only the first finding is supported.
Here Is What the Data Shows
The federal government already collects what the field says it lacks.
Every WIOA participant record in every state contains two fields. One records justice-involvement status at program entry.
Another records whether the participant was still with the same employer in the second and fourth quarters after exit.
In the federal reporting layout, they are elements 801 and 1618. Justice involvement and employer retention, side by side, in the same national file, collected on a federally mandated reporting cycle.
Nobody publishes the comparison.
The honest limits first. The file covers WIOA participants, not every worker, and a program-entry flag is not an employer's fair-chance designation.
Neither limit changes the finding. The two fields sit in one file, and no published analysis crosses them.
California built the pipe and pointed it at a different question. After a 2019 audit, its corrections department contracted with the state's employment agency for quarterly wage data.
The auditor first reported the data unused, then marked the fix fully implemented by late 2020. The wiring works.
What it measures is program outcomes for people leaving prison. Even the state that connected corrections records to wage records is not asking how fair-chance hires compare to the coworkers beside them.
What is missing is not collection. What is missing is the analysis nobody owns.
Read that again. The field has spent a decade debating whether fair-chance hires are risky while the answer sits unqueried in systems built to collect it.
The Two-Tier Structure
I asked a second question, narrower than the first: not whether a statistic exists, but whether anyone is measuring right now.
The answer splits into two tiers. Neither closes the gap.
The first tier is government and research. The Bureau of Justice Statistics has a federal release-cohort employment report due in the fourth quarter of 2026.
The Justice Department is evaluating Second Chance Act grantees. The Labor Department published impact findings from its Reentry Project Grant Evaluation in December 2024.
North Carolina links corrections records to wage records and publishes post-release employment trends.
Every one of these is real, funded, and active. And every one compares people with records to other people with records, or to the general population.
None compares fair-chance hires to the coworkers beside them.
The second tier is employers, and the picture is narrower than the field's confidence suggests. Three companies have named internal mechanisms.
Kelly Services says it measures turnover, cycle times, attendance, reassignment, and mobility in its fair-chance programs.
JBM Packaging's leadership says fair-chance turnover runs below the rest of its workforce. Radius Recycling says it measures hiring and retention outcomes, and its head of human resources has described longer tenure among its fair-chance hires.
Three mechanisms. Zero published methods.
Kelly's own numbers illustrate the problem. Its executive describes a comparison between employees, while its published 2023 result compares client companies with a fair-chance practice to client companies without one.
Two statements, two different comparisons, no stable design.
So the honest count is not zero measurement. It is three companies collecting something, none publishing anything an employer could take to a board.
The Case That Shows the Shape
The Second Chance Business Coalition includes more than fifty major employers. In February 2025 it released a metrics framework with defined measures for attraction, talent acquisition, and retention.
The framework exists. One member company, Radius, is named as operating a collection mechanism, and fragments of its numbers circulate in the coalition's own promotional copy.
The method-transparent parity rates, from any member, do not appear.
Announcing that you will measure is not measuring. A defined metric with no published data is a commitment, not a finding.
The Mechanism
This is not a story about bad faith. It is a story about incentives.
Workforce systems are funded on placement. Placement is what gets counted, so placement is what gets collected, so placement is what gets reported.
The metric determines the data, the data determines the analysis, and the analysis determines what anyone can know.
Change the metric and the data follows. Leave the metric and the question stays unanswerable.
Employers face a version of the same problem. Retention data exists in every payroll system in the country.
Nobody has been asked to segment it, so nobody segments it. The comparison is one query away and the query has no owner.
That is the market failure. Not hostility. Not risk.
A measurement infrastructure still running, still silent on the thing that would actually move employer behavior.
What to Do in the Next 90 Days
If you are an employer: run the comparison on your own payroll. You already have hire dates, termination dates, and performance records.
Segment by fair-chance status and compare twelve-month retention against your general population.
It is an afternoon of analyst time, and it will tell you more about your own risk exposure than any national statistic can.
If you lead a workforce board: your WIOA records already hold justice-involvement status and same-employer retention in the same file. Run that comparison and publish it.
The collection is federally mandated. The analysis is the single fastest path to a defensible number in this field.
If you are a funder: make parity measurement a condition of the grant, not a hope for the report.
A grantee who cannot tell you whether their placements lasted has not told you whether the money worked.
If you are a policymaker: require the comparison in state reporting. The collection mandate already exists. Add the publication requirement.
The Question Under the Question
When an employer asks whether fair-chance hiring is risky, they are asking for evidence.
The honest answer today is that the field cannot produce current evidence either way, and that the systems built to produce it have been reporting the wrong thing for a decade.
That is not a comfortable answer. It is a more useful one than a decade-old statistic dressed as current research.
Two dates tell you where this goes next. The Bureau of Justice Statistics reports on its federal cohort in late 2026.
A new four-state data initiative, Jobs for the Future's Fair Chance to Advance, takes its first submissions in mid-2027, with feeds planned into 2030.
That initiative is being designed right now. If a parity comparison is not built into it, the field will still be recycling pre-2019 evidence at the end of the decade.
You do not have to wait for either one.
The data is in your payroll system. It is in your state's WIOA file.
It is in the records you already keep and already report.
Run the query.
Take the free Durability Index Self-Assessment. Twenty questions. Five domains. One score.
Until next time, keep building what they said couldn't be built.
Khalil Osiris
Author and Founder, Khalil Osiris Consulting | Market Architect, The Durability Economy Workforce Architecture
The Durability Economy. Workforce redesign, fair-chance hiring, and household stability. For leaders who measure what lasts.
Change the metrics. Change the outcomes.
Subscribe to The Durability Economy
Get the weekly briefing on workforce transformation, criminal justice reform, and the 2Gen Economy, delivered straight to your inbox. Evidence over ideology. Households over headcounts.
We hate SPAM. We will never sell your information, for any reason.